Percona Monitoring and Management 3.2.0
| Release date | May 15th, 2025 |
|---|---|
| Installation | Installing Percona Monitoring and Management |
| Upgrade | Migrate PMM 2 to PMM 3 |
Percona Monitoring and Management (PMM) is an open source database monitoring, management, and observability solution for MySQL, PostgreSQL, and MongoDB.
PMM empowers you to:
- monitor the health and performance of your database systems
- identify patterns and trends in database behavior
- troubleshoot issues effectively
- execute database management tasks seamlessly, whether your databases are on-premises or in the cloud
Release summary
Release highlights
Native PMM Client support for Amazon Linux 2023
PMM 3.2.0 introduces official RPM package support for installing the PMM Client on Amazon Linux 2023. If you’ve been deploying PMM Client on AL2023 and relying on tarball-based installation workarounds, you no longer need to — you can now install the Client through native RPM packages.
This streamlines the setup process and integrates more seamlessly with your AL2023 environment, making it quicker and easier to get started with monitoring databases.
Enhanced MySQL 8.4 support
PMM 3.2.0 completes our support for MySQL 8.4. While PMM 3.0.0 provided partial support with Query Analytics (QAN) and basic dashboard features, it couldn’t monitor replication metrics due to MySQL 8.4’s shift in exposing replication status from traditional status variables to performance_schema tables.
With this release, we’ve upgraded the MySQL Exporter to version 0.17.2, enabling it to collect replication metrics from both legacy status variables and the new performance_schema tables. We’ve also reconfigured the MySQL Replication Summary dashboard to display these metrics properly regardless of their source.
This means that PMM can now provide complete replication monitoring across all supported MySQL versions (5.7, 8.0, and 8.4), including critical metrics like IO Thread status, SQL Thread status, and Replication Lag.
Grafana 11.6 update
PMM now ships with Grafana 11.6, which delivers enhanced visualization capabilities, a streamlined alerting experience, and a wide range of performance and UI improvements:
- Alert state history allows you to review historical changes in alert statuses over time. Full functionality requires Grafana Loki for log aggregation and specific Grafana configuration to enable centralized tracking and storage.
- Improved panel features and actions visualization for better dashboard interactivity
- Simplified alert creation with improved UI workflows
- Recording rules for creating pre-computed metrics to optimize dashboard performance
Dashboard improvements: - Navigation bookmarks for quick access to frequently used dashboards - State timeline supports pagination for better performance with large datasets - Centralized alert history page for managing all alert rules - Improved Grafana Scenes support for modern dashboard architecture
GSSAPI authentication support for MongoDB
You can now connect to MongoDB (and Percona Server for MongoDB) using the GSSAPI authentication mechanism, commonly used in Kerberos environments.
If you previously encountered errors when attempting to monitor MongoDB with GSSAPI (e.g., GSSAPI support not enabled during build), this update resolves the issue. You can now pass the appropriate GSSAPI credentials and connection parameters using pmm-admin, improving compatibility with secure enterprise environments that rely on Kerberos. For setup instructions, see the PSMDB documentation.
Secure external ClickHouse connections
PMM now supports connecting to external ClickHouse servers using authenticated credentials. You can now set the PMM_CLICKHOUSE_USER and PMM_CLICKHOUSE_PASSWORD environment variables when deploying PMM Server to enable access to password-protected ClickHouse instances, such as those managed by Altinity’s operator. This resolves previous authentication errors and removes the need to embed credentials in the address string.
Label-based access control for Query Analytics
Query Analytics (QAN)| now supports label-based access control (LBAC), enabling fine-grained, role-based visibility into query data. Users only see the databases and services permitted by their roles—filter options are automatically restricted based on labels.
This makes it easy to limit access by technology (e.g., MySQL-only), environment (e.g., production), or region, enhancing both security and clarity. To test it, set up a PMM Server, connect MySQL and PostgreSQL databases, enable access control, and define roles using LBAC selectors.
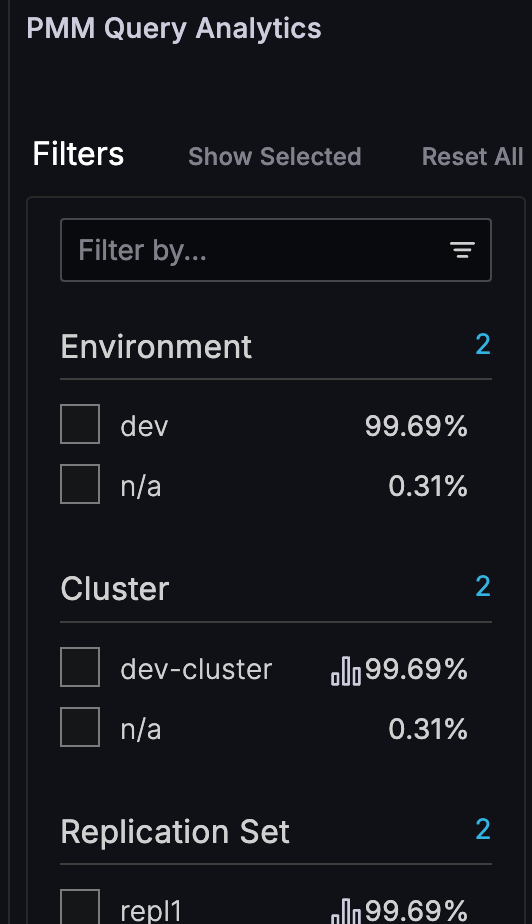
Improved Query Analytics filter performance
We’ve significantly improved Query Analytics (QAN) filter loading performance by optimizing the database queries that power the filter sidebar. The optimization reduced the number of processed rows by up to 95% in large environments, resulting in faster filter population and more responsive QAN interface.
PBM Dashboard
We’ve added a new PBM Details Dashboard. This dashboard will display important data about Percona Backup for MongoDB including PBM agent status, Whether backup is configured, If PITR is enabled or not, Backup size, Backup duration, Backup history and Last successful backup name and time.
Improvements
- PMM-13406- We’ve integrated HashiCorp Nomad into PMM — a powerful workload orchestrator designed to improve resource allocation and enable future extensibility. Nomad is disabled by default, and although the Docker image size has slightly increased, this additional footprint has no impact on performance when Nomad remains disabled.
Initially, Nomad will assist with managing monitoring agents, enhancing service delivery for Percona customers, and providing a foundation for future feature development. For more information, see Nomad configuration for Percona teams.
-
PMM-13869 - PMM now outputs Nginx access logs in LOGFMT format, ensuring consistency across all PMM components. This also improves compatibility with log analysis tools like Loki and VictoriaLogs, which means that you can analyze logs directly without reformatting or manual parsing.
-
PMM-13939 - Improved the performance of a frequently used query in Query Analytics (QAN) by optimizing the number of rows fetched from the database. This change reduces the time it takes to display QAN filters, resulting in a smoother user experience.
-
PMM-13873 - Upgraded MySQL Exporter to the upstream version 0.17.2, which support MySQL version 8.4. “MySQL Replication Summary” and “MySQL Group Replication Summary” dashboards have been updated to support this version.
-
PMM-13824 - Updated MongoDB Replicaset summary dashboard and MongoDB Sharded cluster summary dashboard with a new panel to show current Feature Compatibility Version. We’ve also added panels to show Nodes, Databases count and Last election time.
Fixed issues
- PMM-13770 -
-
PMM-13780 - Fixed an issue in the SQL query parser that prevented group replication metrics from being collected. The MySQL Group Replication Summary dashboard now properly displays transaction and conflict metrics for MySQL 8.0 and 8.4 environments.
-
PMM-13635 - Fixed an issue in the MongoDB collections overview dashboard where computation of the values for a few panels were incorrect. Fixed the Top 5 Databases By Size panel to show correct data based on the MongoDB node and Replication set filters.
-
PMM-13694 - Fixed an issue where PostgreSQL QPS calculations were incorrect in Query Analytics (QAN) when using non-default
pg_stat_statements.maxvalues greater than5000.